System Information
System Info combines system and performance monitoring for the console.
To add a System Info window, follow the instructions under Add windows.
In the Add Window pop-up:
- Tap More.
- Tap System Info.
The System Info window opens.
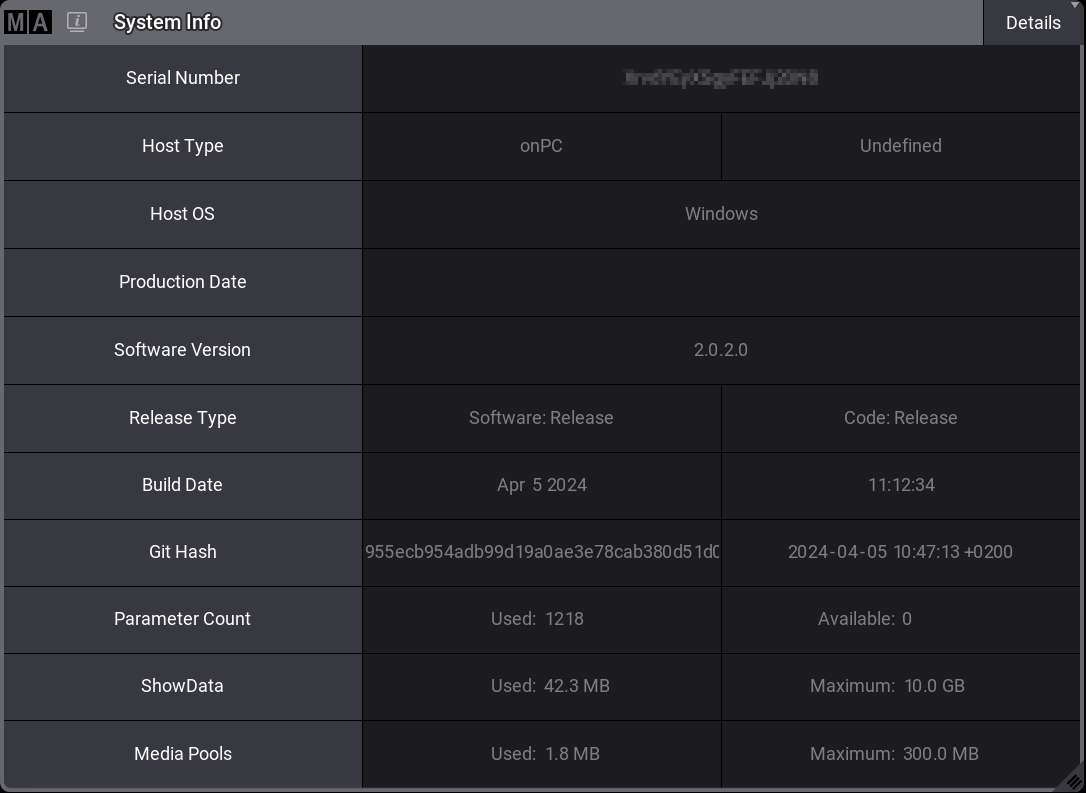
System Info – details on onPC
To adjust the System Info window settings, follow the instructions under Window Settings.
Temperature Check
Section titled “Temperature Check”CPU, GPU, and system temperatures can be displayed on:
- grandMA3 full-size
- grandMA3 light
- grandMA3 replay unit
- grandMA3 compact XT
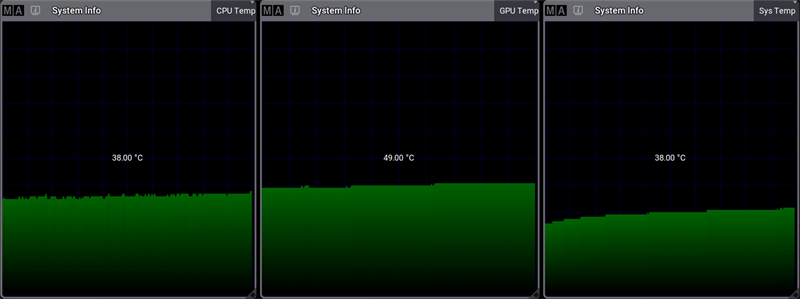
Example of temperature windows
The grandMA3 compact can only display CPU and system temperatures.
These products are not able to display temperature information:
- grandMA3 extension
- grandMA3 processing unit
- grandMA3 nodes
- grandMA3 viz-key
- All grandMA3 onPC solution devices
Fan Check
Section titled “Fan Check”The fan view in the System Info window displays the system/CPU cooling fan speed in correlation to its maximum speed.
Fan speeds can be displayed on:
- grandMA3 full-size
- grandMA3 light
- grandMA3 replay unit
- grandMA3 compact (XT)
These products are not able to display fan speed information:
- grandMA3 extension
- grandMA3 processing unit
- grandMA3 nodes
- grandMA3 viz-key
- All grandMA3 onPC solution devices
System Info is divided into different views, which can be selected using the button in the title bar on the right-hand side.
Tap and hold the button to toggle between:
- Realtime: Displays the system’s workload in milliseconds per DMX frame.
- Timing: Displays the time required to render the console screens. MainLoop, Swap, and End show the internal processing and the displays on which it takes place.
- CPU: CPU displays the workload of the main processor.
- Memory: Displays the system’s RAM in GB.
- CPU Temp: Displays the console’s current temperature.
- GPU Temp: Displays the current temperature of the console’s graphics processing unit.
- Sys Temp: Displays the current temperature of the central computer board.
- Fan: Displays the cooling system fan’s rotational speed in RPM.
- Details: Displays other relevant system info, such as the serial number or the build date.
- HDD: Lists relevant information about available hard drives.
- Network: Lists the number of connected and expected stations in the session. Green numbers show the expected numbers of devices. Red shows when a device is disconnected.
 | Hint: |
| Graphs such as the Memory graph show the current used value on the left and the total value on the right. |
The title bar can be enabled or disabled by tapping Show Title Bar in the System Info Window Settings.